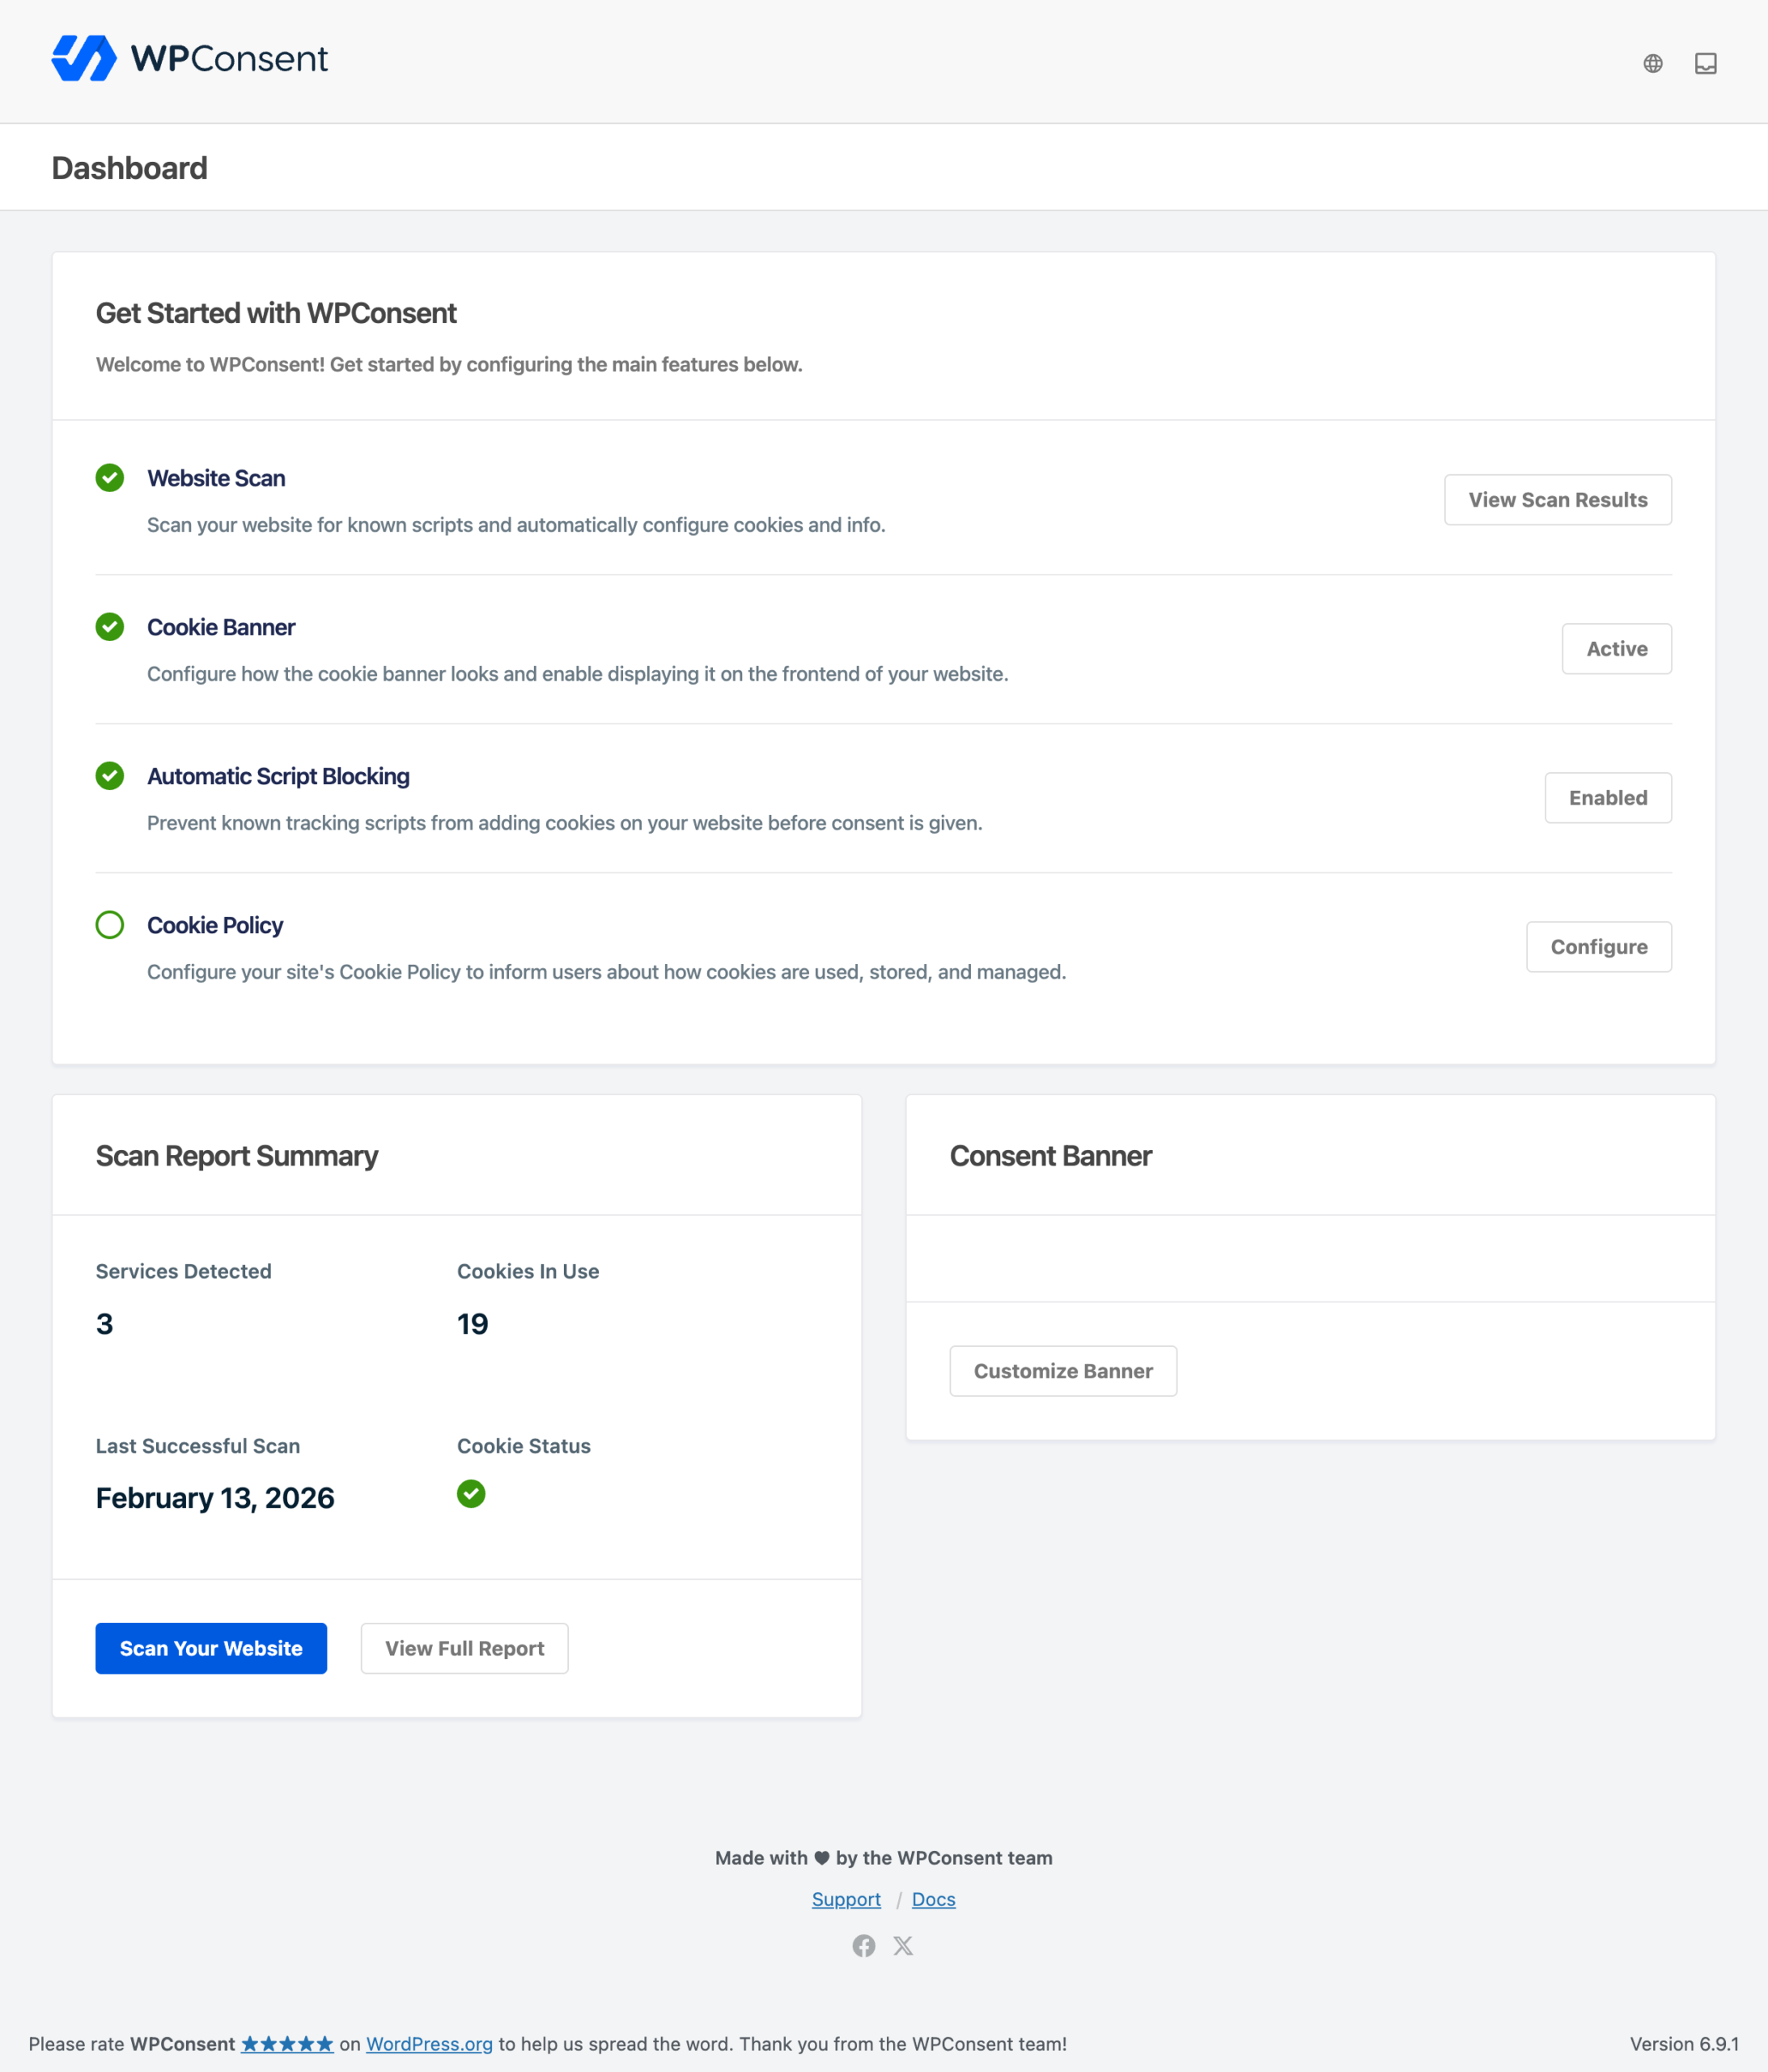
Want a quick look at your cookie consent setup? The WPConsent dashboard gives you an at-a-glance summary of your scan results, banner status, and remaining setup steps. This dashboard overview walks you through each section so you know exactly where to find what you need.
Table of contents
- Prerequisites
- Opening the dashboard
- Navigating the admin area
- Exploring the setup checklist
- Reviewing the scan report summary
- Previewing the banner
- FAQ
- Conclusion
Prerequisites
Before you begin, make sure you’ve completed the following:
- WPConsent is installed and activated on your WordPress site. If you haven’t done that yet, see our installation guide.
- You’ve run through the setup wizard at least once.
Opening the dashboard
To open the dashboard, go to WPConsent >> Dashboard in your WordPress admin sidebar. This is also the default landing page whenever you click the top-level WPConsent menu item.
The header at the top of every WPConsent page shows the plugin logo on the left and a notification inbox icon on the right. Click the inbox icon to open a slide-out drawer with your active and dismissed notifications.
Navigating the admin area
WPConsent adds a top-level menu in your WordPress admin sidebar. Here’s a breakdown of every submenu page:
| Menu item | Purpose |
|---|---|
| Dashboard | Setup checklist, scan summary, and banner preview |
| Banner Design | Layout, styling, and content customization |
| Scanner | Run scans and view results |
| Settings | Manage cookie categories, services, cookies, and plugin settings |
| Geolocation | Location-based consent rules (paid version) |
| Tools | Import, export, and system info |
| Consent Logs | Records of visitor consent (paid version) |
| Do Not Sell | CCPA/CPRA “Do Not Sell” request management (paid version) |
Exploring the setup checklist
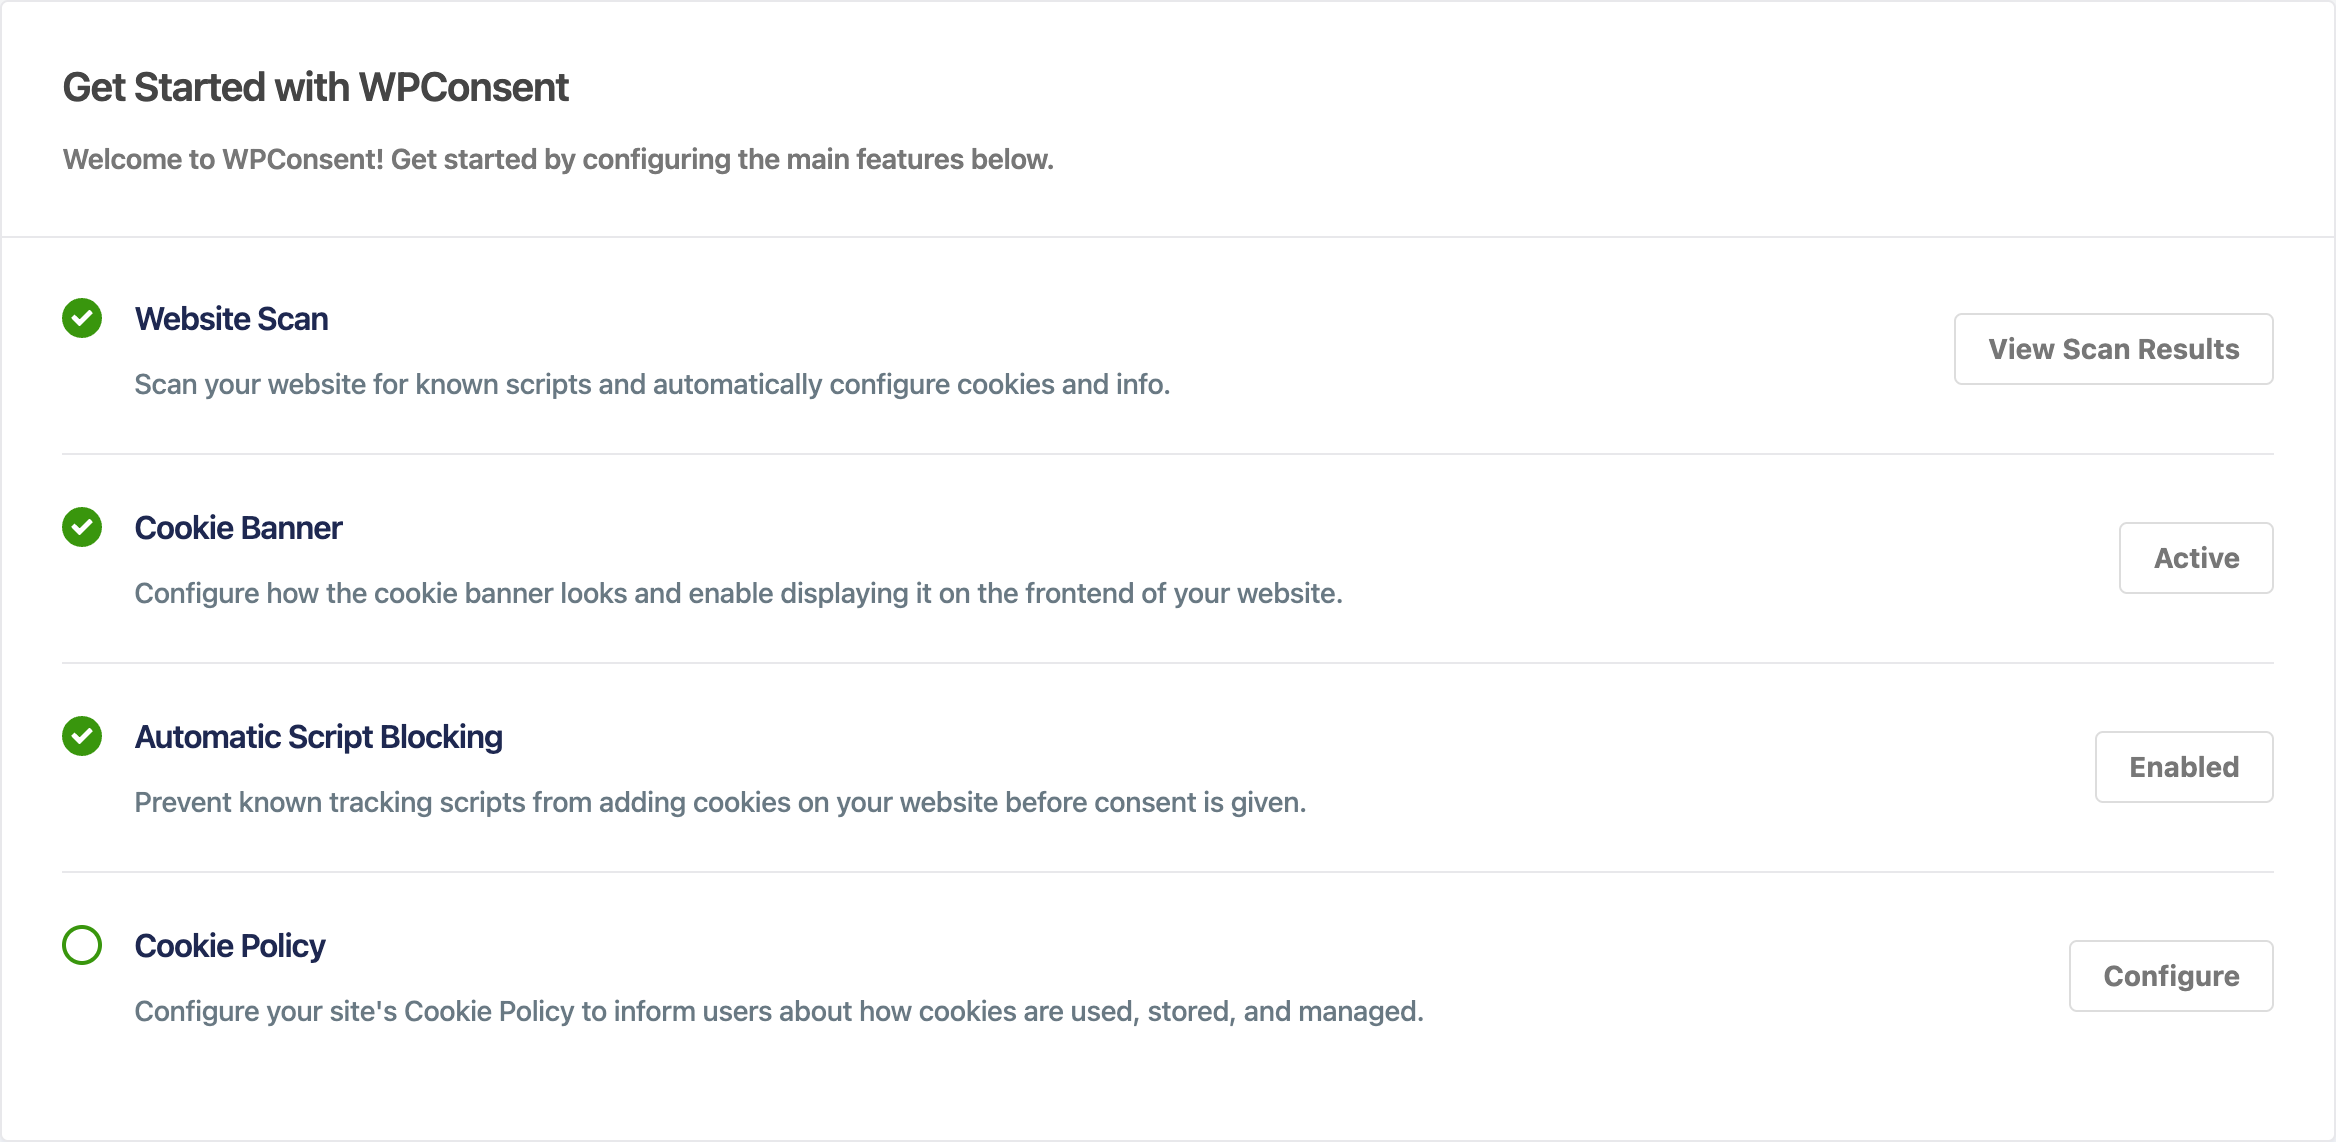
The top section of the dashboard is titled Get Started with WPConsent. It contains 4 items, each with a checkbox, a description, and an action button.
| Checklist item | Description | Completed when |
|---|---|---|
| Website Scan | Scan your website for known scripts and automatically configure cookies. | You’ve run at least 1 scan. |
| Cookie Banner | Configure how the banner looks and enable it on the frontend. | The enable_consent_banner setting is turned on. |
| Automatic Script Blocking | Prevent known tracking scripts from setting cookies before consent. | The enable_script_blocking setting is turned on. |
| Cookie Policy | Set up your cookie policy page to inform visitors about cookie usage. | A cookie policy page is selected in settings. |
Each item displays a green checkmark when it’s complete. The action button label changes based on status. For example, the Cookie Banner row shows Activate Banner when the banner is disabled and Active when it’s enabled. Clicking any button takes you to the relevant settings page.
Reviewing the scan report summary
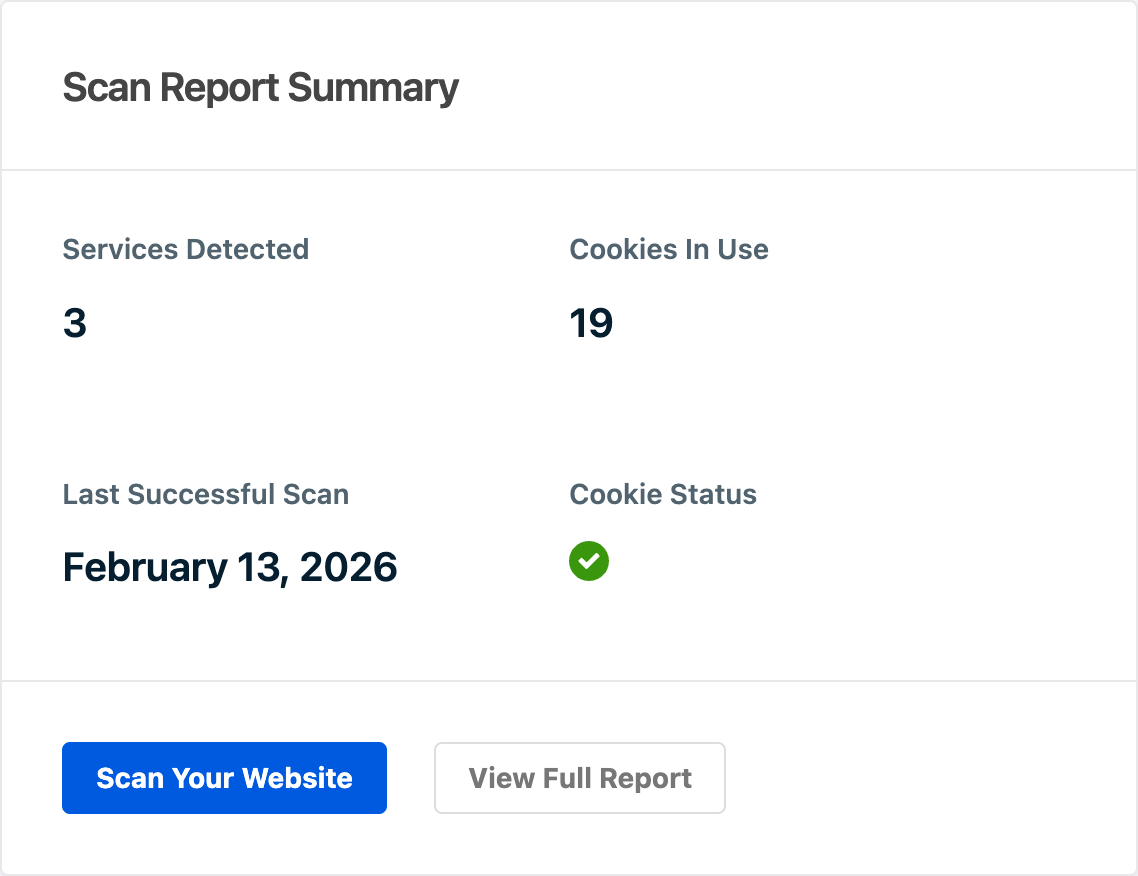
Below the checklist on the left side, you’ll find the Scan Report Summary box. It displays 4 statistics from your most recent scan:
- Services Detected: the number of third-party services found on your site.
- Cookies In Use: the total number of cookies tied to detected services.
- Last Successful Scan: the date of your most recent scan, or “Not yet scanned” if you haven’t run one.
- Cookie Status: a checkmark that shows whether scan results have been configured into cookie and service records.
At the bottom of this box, you’ll see 2 buttons:
- Scan Your Website takes you to the scanner to start a new scan.
- View Full Report appears only after you’ve completed a scan. It links to the scanner page with your detailed results.
Previewing the banner
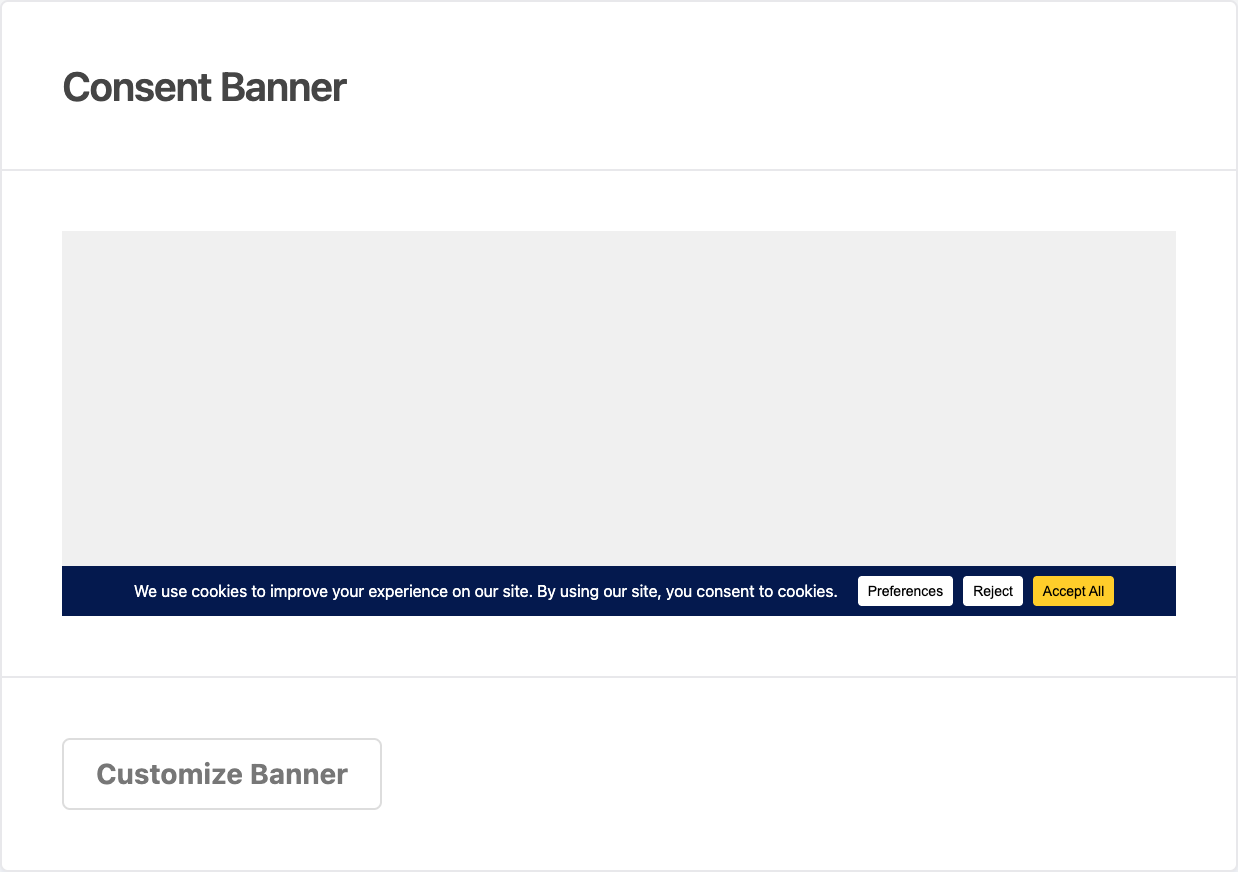
On the right side, the Consent Banner box shows a live preview of your current banner design. It reflects your saved layout, position, colors, and text. This gives you a quick visual check without leaving the dashboard.
To customize your banner, click the Customize Banner button at the bottom of the box. It takes you to the banner design page where you can adjust layout, styling, and content.
FAQ
Why don’t I see any scan data on my dashboard?
You need to run your first scan before data appears. Head to WPConsent >> Scanner and click Scan Your Website to get started.
Can I rearrange the dashboard sections?
No, the dashboard layout is fixed. The setup checklist always appears at the top, with the scan summary and banner preview side by side below it.
How do I know if my setup is complete?
All 4 checklist items show a green checkmark when complete. Once they do, your basic consent setup is in place.
Conclusion
The WPConsent dashboard is your home base for cookie consent management. It brings together the setup checklist, scan report summary, and banner preview so you can quickly check your site’s consent status. If any checklist items still need attention, their action buttons link directly to the right page.
For your next step, we recommend learning how to scan your website for cookies and scripts.